Customer Experience Built For Transit

Transform rider feedback into strategic intelligence

Stop guessing what riders value. FlagTransit captures real-time satisfaction data across your entire system giving you the evidence to prove community impact, allocate resources strategically, and earn stakeholder trust.

taskopiya-service- two
The Flag principle

You cannot manage what you do not measure. We make measurement effortless

taskopia-service-three-image-simplified
Statistically Valid Results

Random intercept methodology meets modern technology. QR codes deployed system-wide ensure unbiased sampling capturing voices from first-time riders, language minorities, and shy passengers who wouldn't seek out a survey.

taskopia-service-three-image-simplified-8
Mask group (5)
 Real-Time Performance Dashboards

See satisfaction by route, time of day, depot, and demographic segment. Identify service gaps before they become crises. Deploy resources based on evidence, not anecdotes.

taskopia-service-three-image-simplified-6
 INDUSTRY-LEADING RESPONSE RATES

Average 77% response rates vs. 8-12% industry standard. Fast, mobile-first surveys that riders actually complete.

Task management dashboard
taskopia-service-one-our-image-two
PROACTIVE, NOT REACTIVE

Customer service fixes problems. Customer experience prevents them.

Rider feedback shouldn't wait for complaints. FlagTransit captures satisfaction continuously across every route, every shift, every demographic so you can identify and fix issues before riders stop showing up.

specialiti-icon-1
Real-time satisfaction tracking

Traditional surveys are annual snapshots. FlagTransit runs continuously capturing 75K+ responses monthly. See satisfaction trends as they develop, not months after problems started.

why choose us

Unbiased sampling, statistically valid results

Our rider feedback platform captures voices you'd never hear through traditional surveys ensuring every demographic, every route, and every rider segment is represented.

Granular Segmentation

Break down satisfaction by any variable: time of day, transfer points, trip purpose, rider frequency, vehicle conditions.

Predictive Trending

Three weeks of declining evening satisfaction on Route 42 isn't random it's a leading indicator. Intervene before the complaints start.

REAL-TIME COORDINATION

Unified visibility, coordinated response. Seamless operation

databaseicon-1
Cross-platform access

Dispatchers see incidents in real-time. Field supervisors access via mobile. Executives pull reports for board meetings. Same data, every device.

Pattern detection

See complaint clusters before they explode. 15 cleanliness reports on Route 7 this week? Deploy cleaning crew before it hits social media.

24/7 intelligent response

After-hours AI acknowledges submissions instantly, mimicking your agency's communication style. Staff reviews during business hours with full context

taskopia-integration-icon-2
taskopia-integration-icon-1
taskopia-integration-icon-7
taskopia-integration-icon-6
taskopia-integration-icon-5
PREDICTIVE INTELLIGENCE

One platform to listen, measure, communicate and improve

Capture rider feedback in real time, track satisfaction trends, and turn insights into service improvements your community can feel

Measure what matters

Track CSAT scores, resolution rates, and response times across routes, stops, and service types—all in one dashboard.

Predictive resource allocation

Use historical trends and real-time data to position security, cleaning crews, and supervisors where they're needed next—not where they were needed yesterday

Frequently asked questions

Still Deciding? Start Here.

 How do riders submit feedback through FlagTransit?

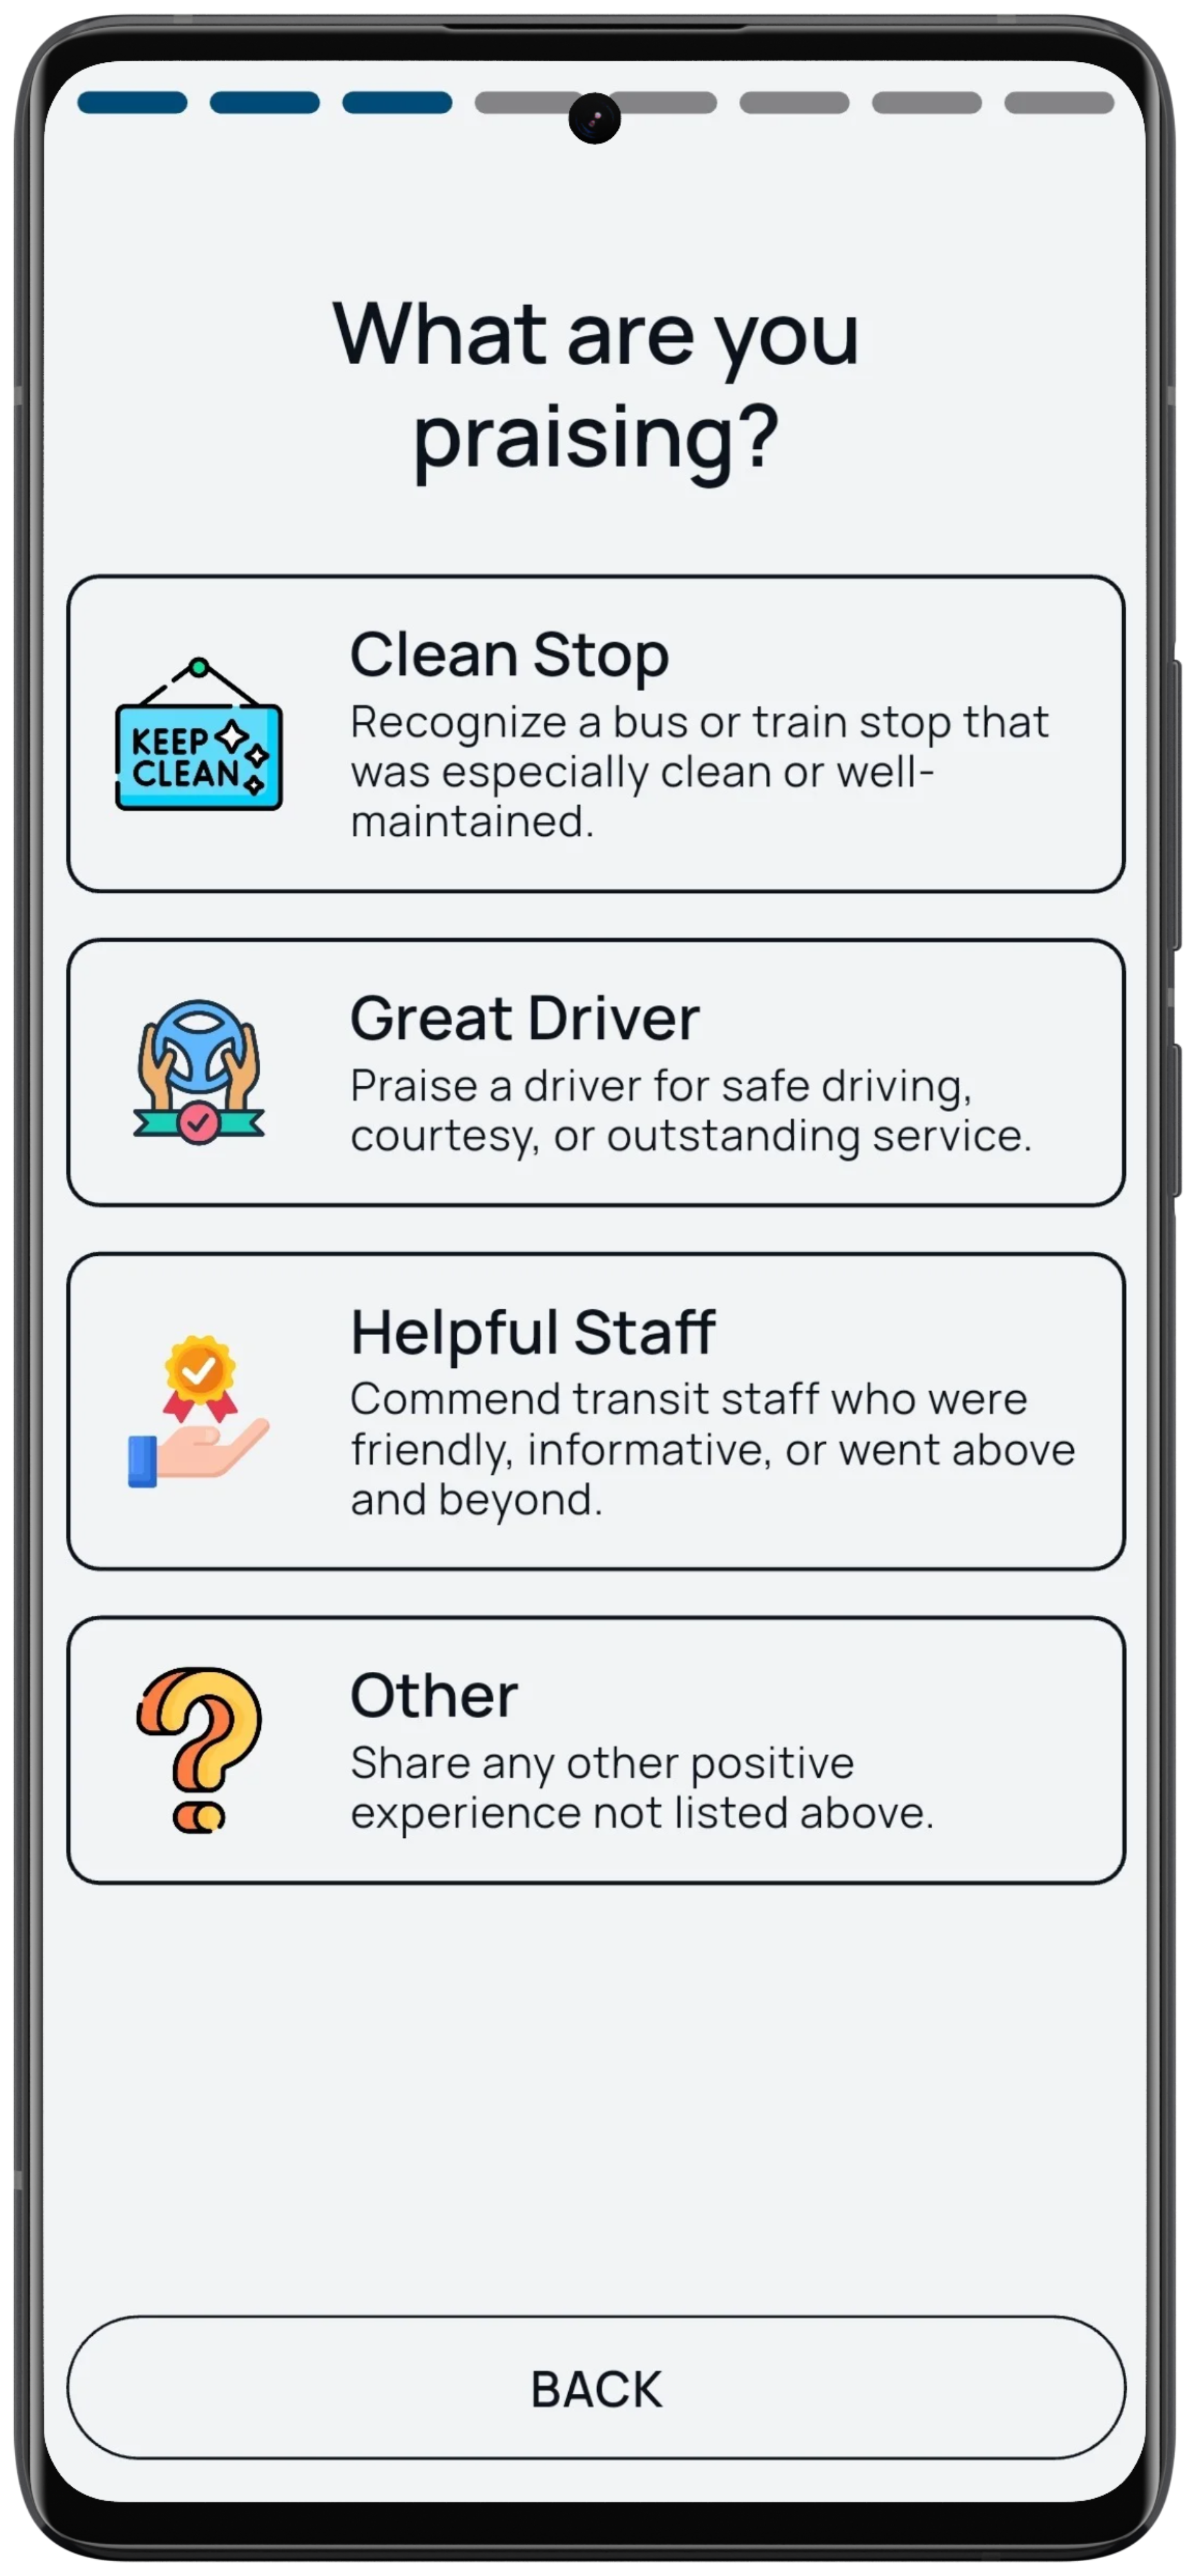
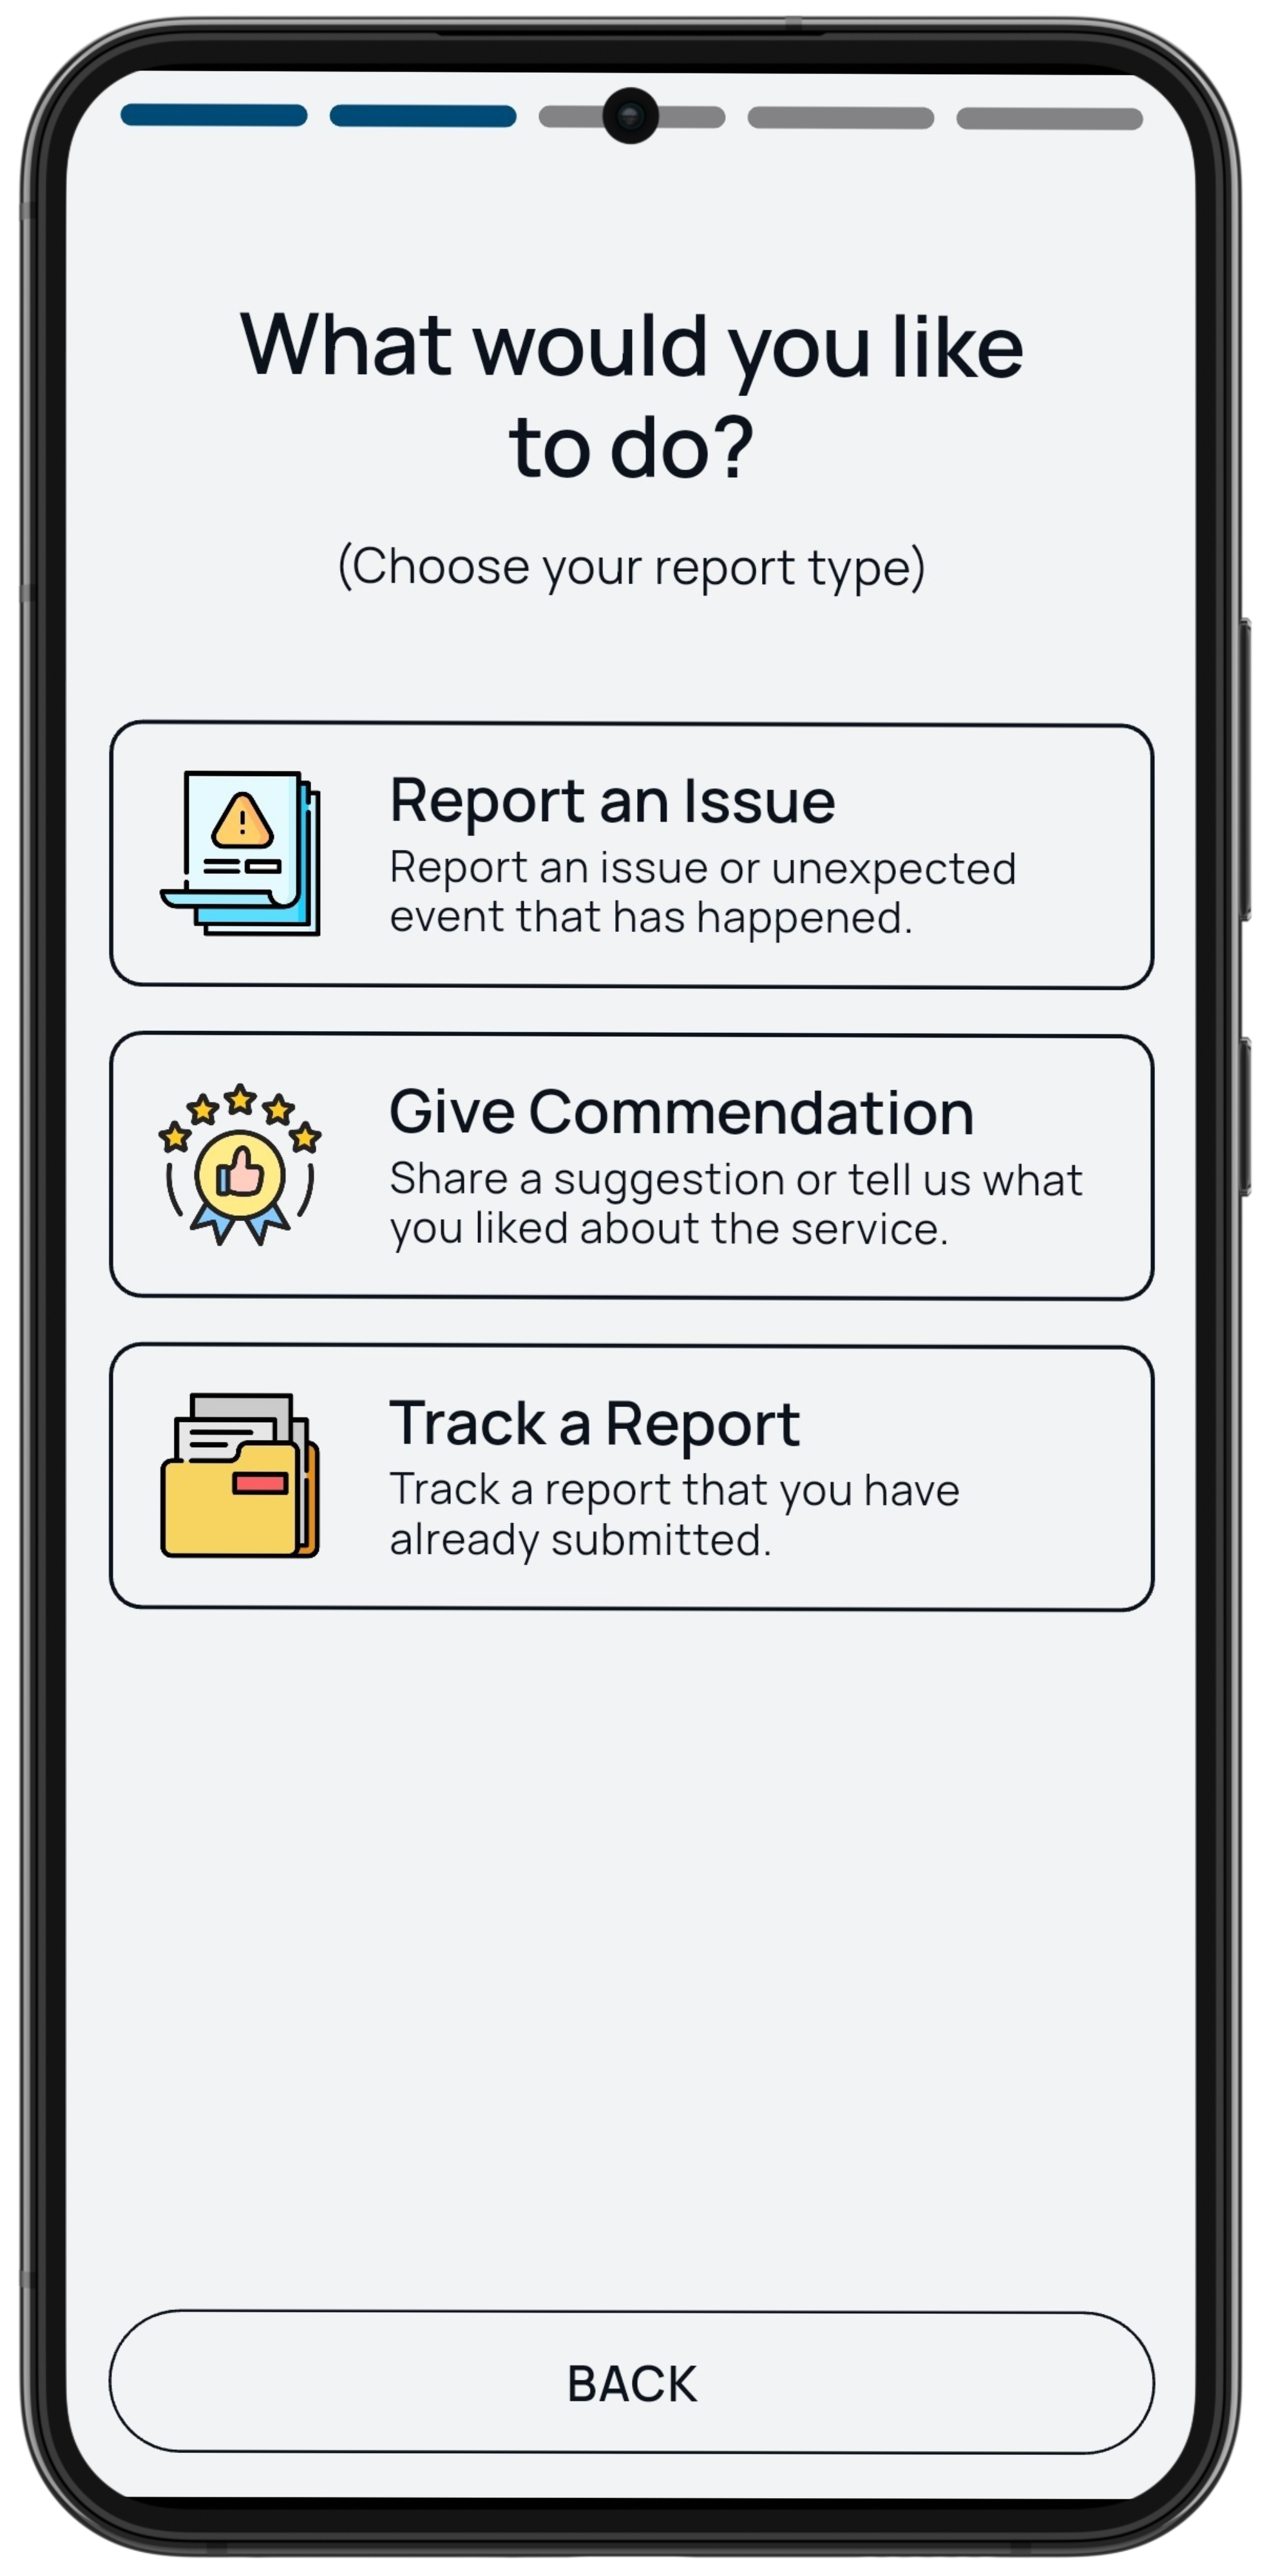
We meet riders where they are—any language, any platform. They can use text, voice, email, or web to report issues. We auto-tag details like route, location, and time, so all they have to do is focus on what happened. The entire process takes under 30 seconds. This removes friction and dramatically increases the volume of feedback you receive compared to traditional comment cards or phone lines.

 What's the difference between customer service and customer experience?

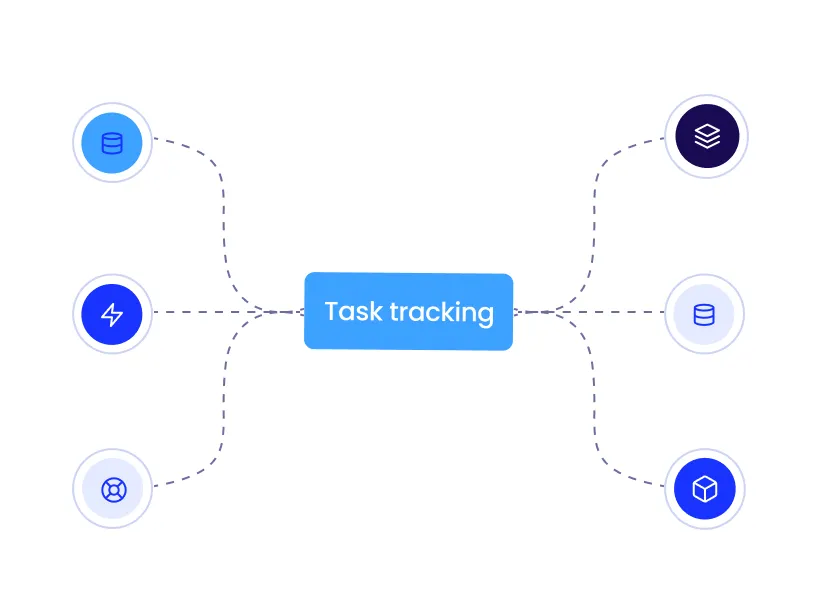
Customer service is reactive—it responds when something goes wrong. Customer experience is proactive—it shapes the entire rider journey to prevent problems before they occur. FlagTransit enables both: immediate response to individual reports plus trend analysis that helps you identify systemic issues like recurring cleanliness problems on specific routes or peak-hour safety concerns. When you design for experience, you reduce the complaints that require service.

How does FlagTransit help us measure customer satisfaction?

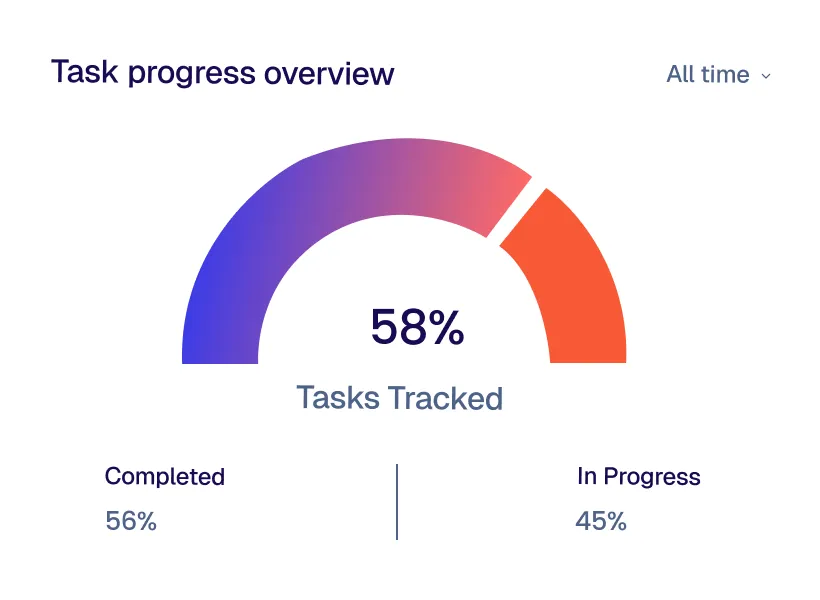
The platform tracks key CX metrics in real time: CSAT scores, average response times, resolution rates, and feedback volume by category, route, and time period. You can filter by issue type (cleanliness, safety, ADA, harassment) to understand where satisfaction is strong and where it needs attention. As your documents note: "You cannot manage what you do not measure"

Can we use FlagTransit data for Title VI compliance reporting?

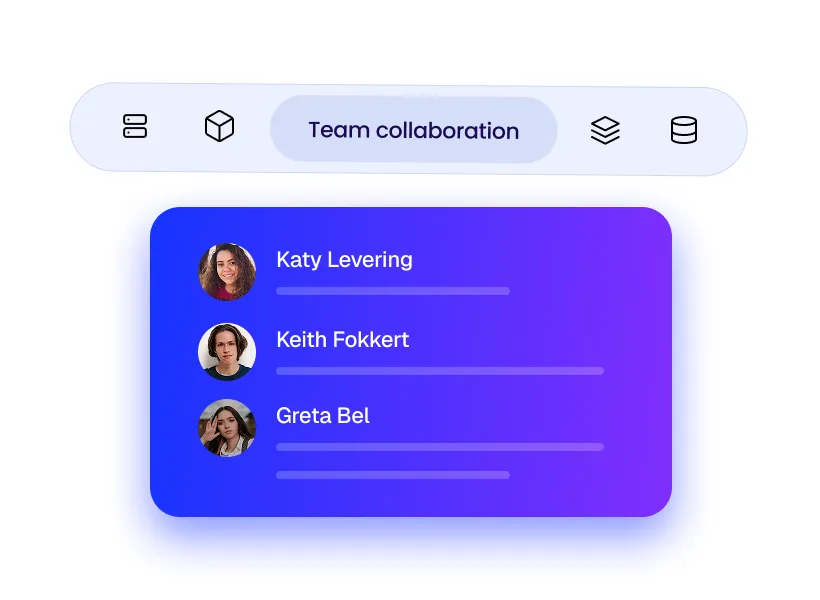
Yes. When demographic questions are embedded in your feedback surveys, you can cross-tabulate satisfaction results with Title VI variables. This reveals whether minority or low-income riders experience lower satisfaction on specific routes or service types—turning a compliance exercise into actionable equity insights. One data collection effort serves both customer experience and federal reporting requirements.

How does improving customer experience impact ridership and funding?

Rider perception of safety and reliability directly affects whether people choose transit. Agencies that demonstrate measurable improvements—shorter response times, higher resolution rates, increased satisfaction scores—build credibility with customers, boards, and funding partners. As one of your case studies showed, Toledo passed a transit sales tax on the second attempt specifically because leadership could show voters concrete outcomes rather than just asking for money. Performance builds trust, and trust attracts investment.